 |
 |
 |
|
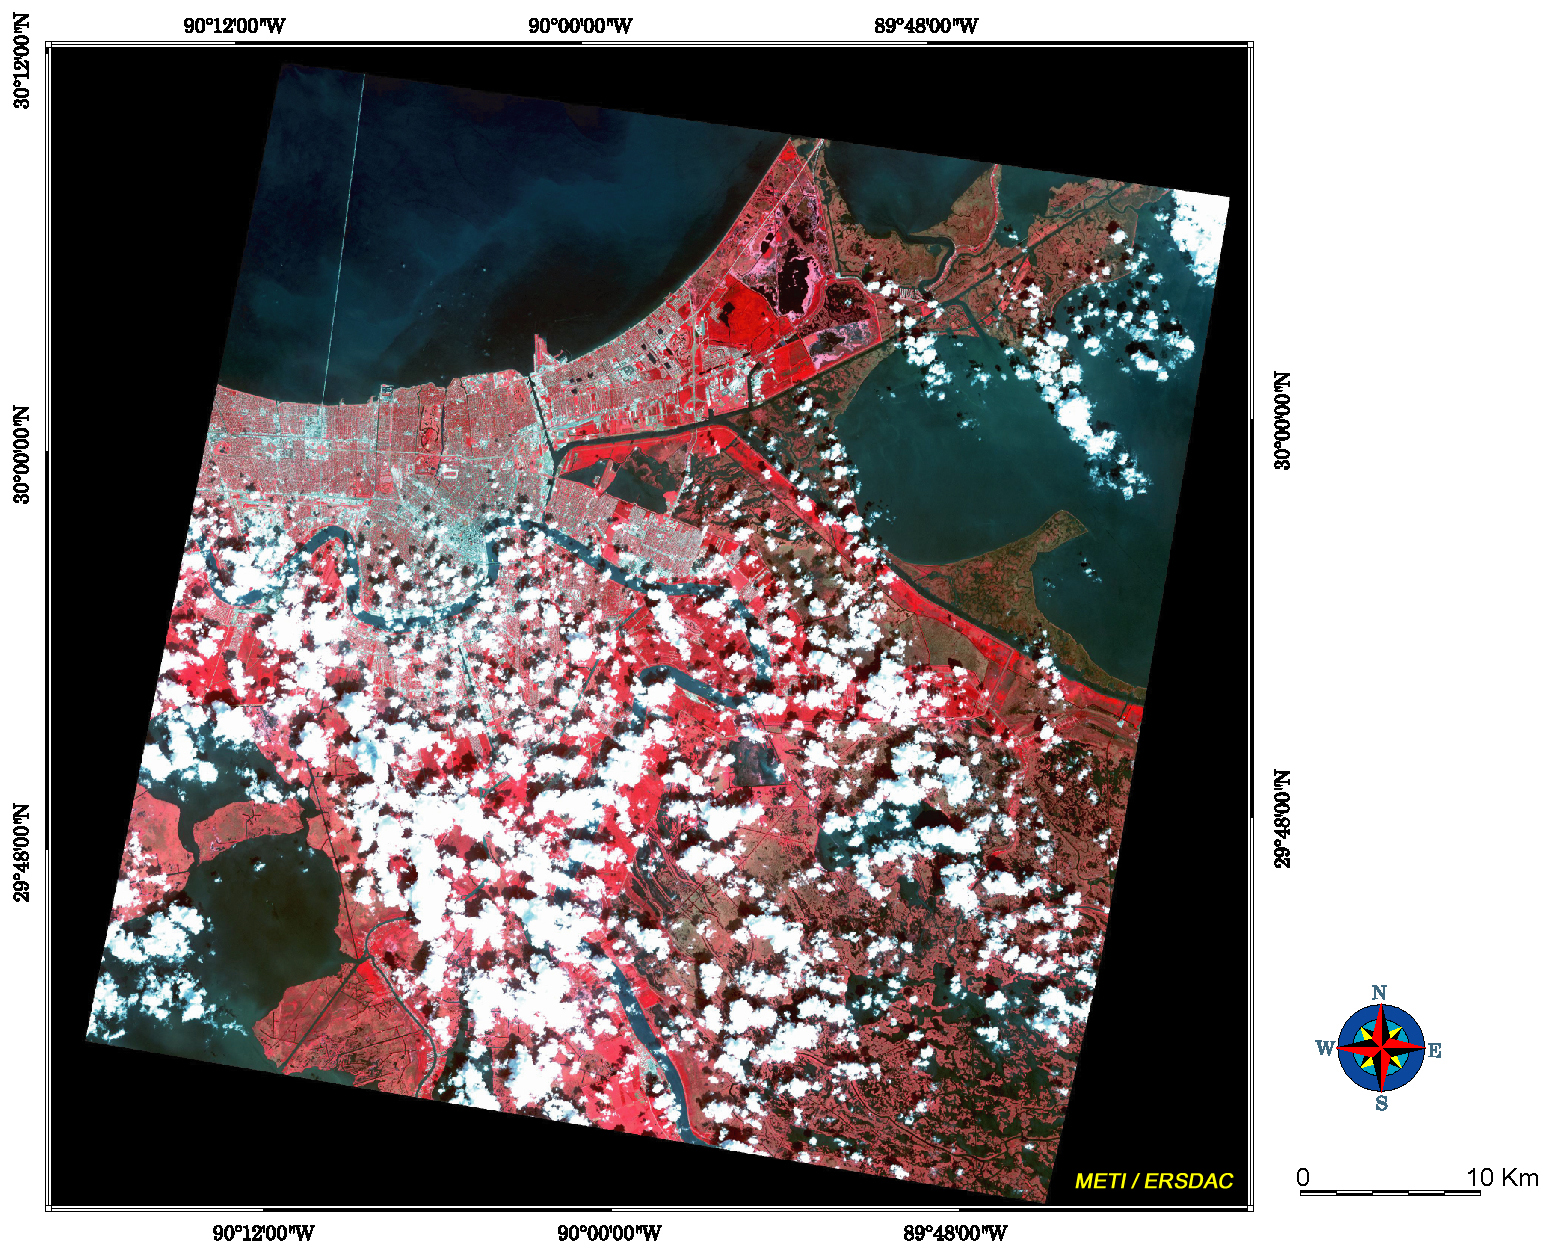
Figure 1.
False Color image observed on 2001.09.20 |
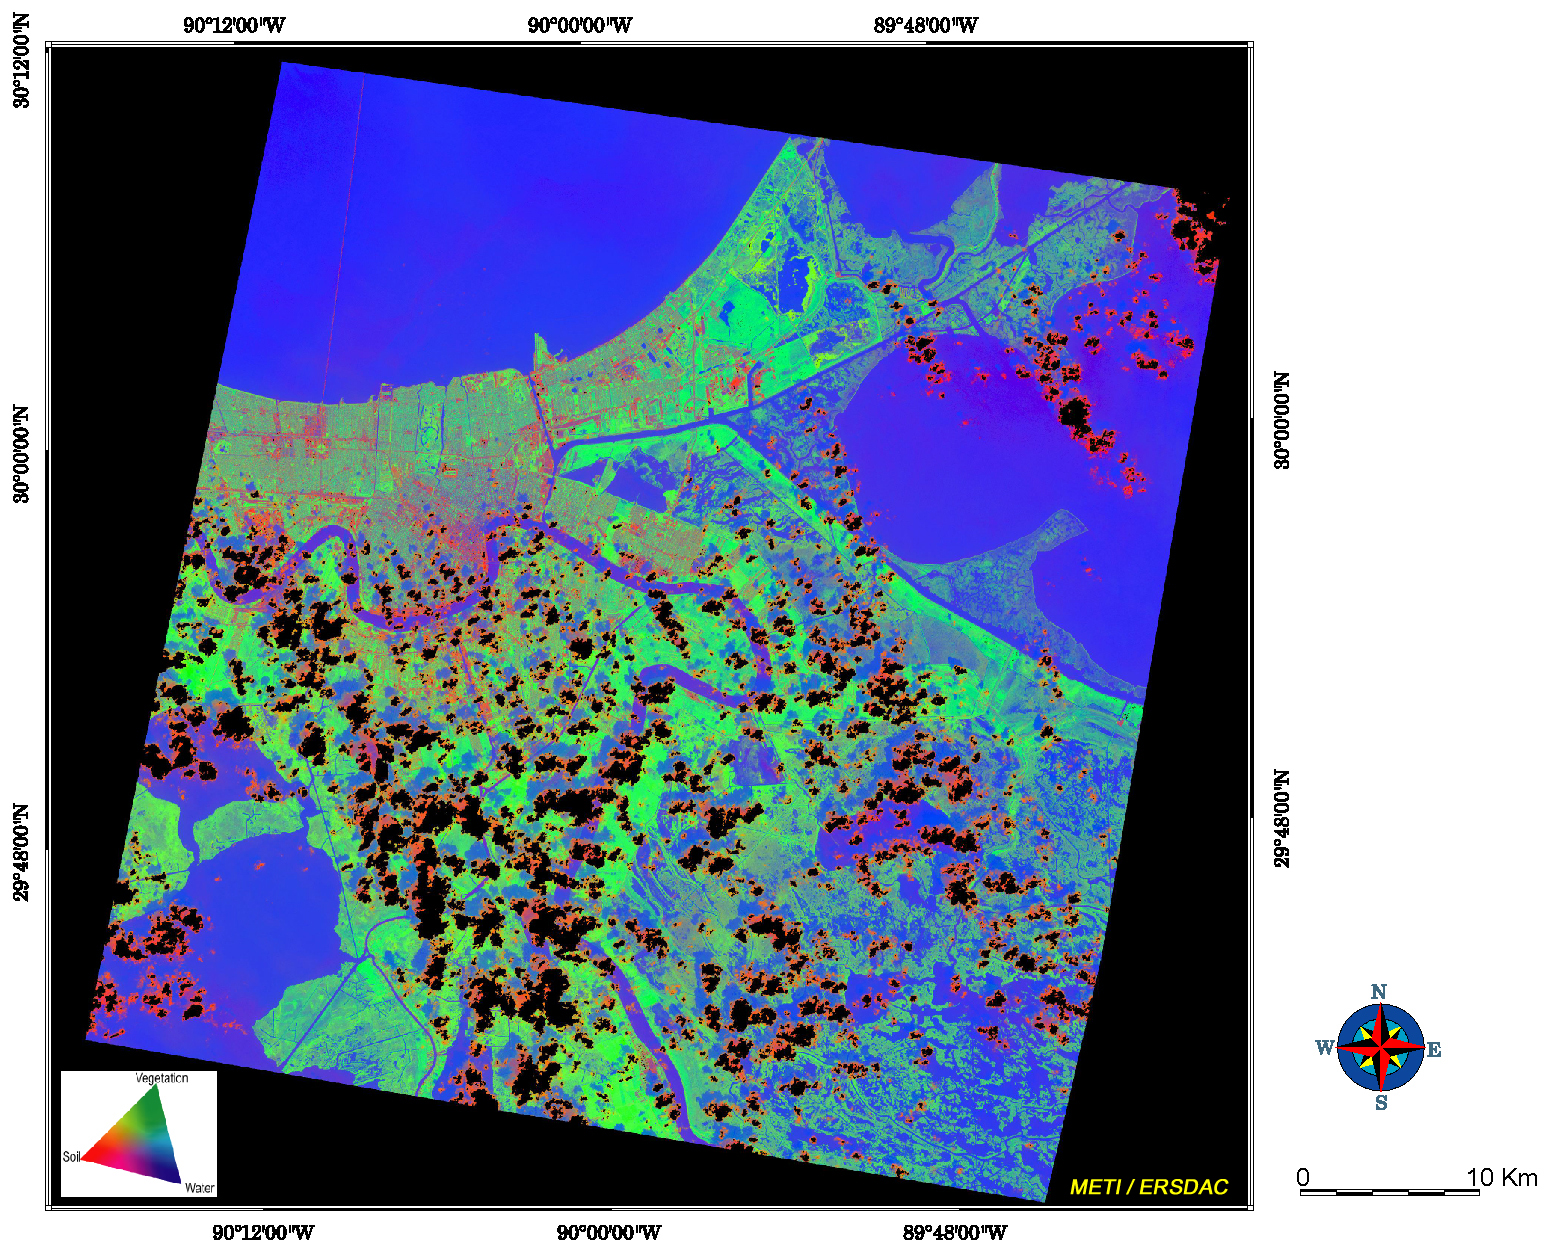
Figure 3.
VSW image observed on 2001.09.20 (B:G:R= water:vegetation:soil index) |
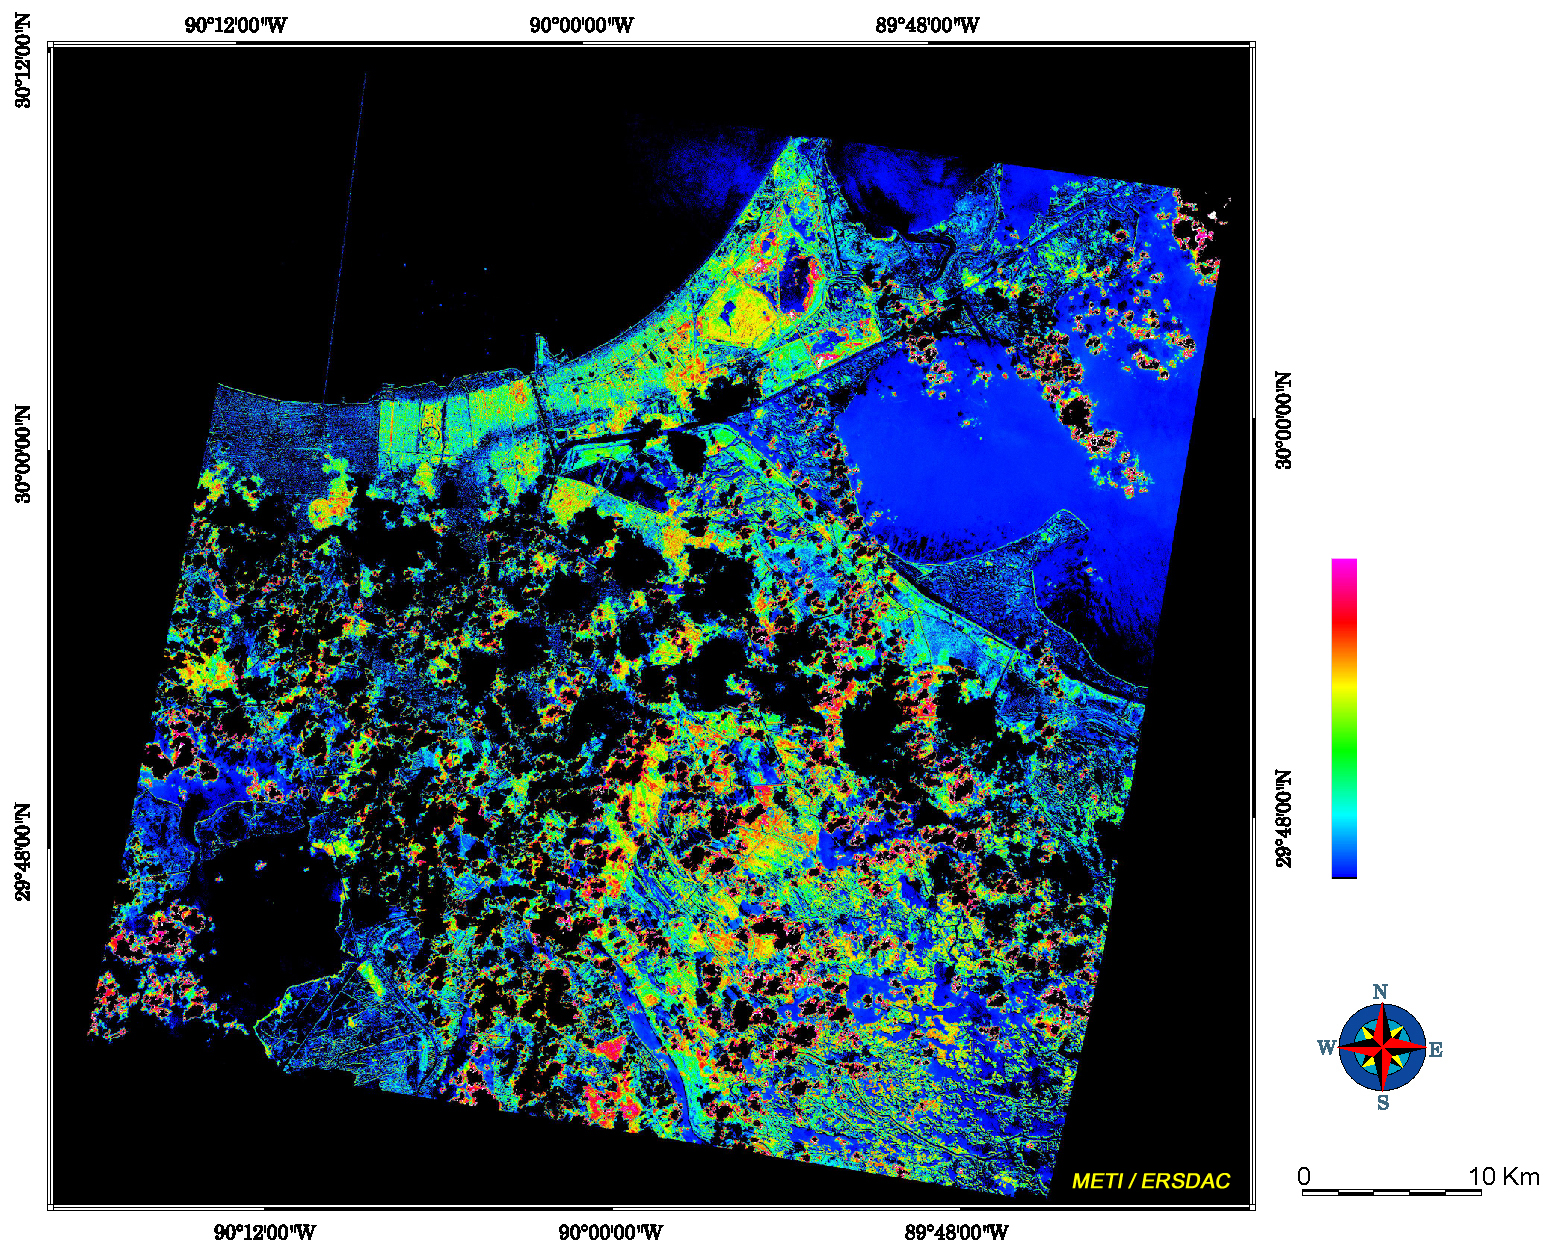
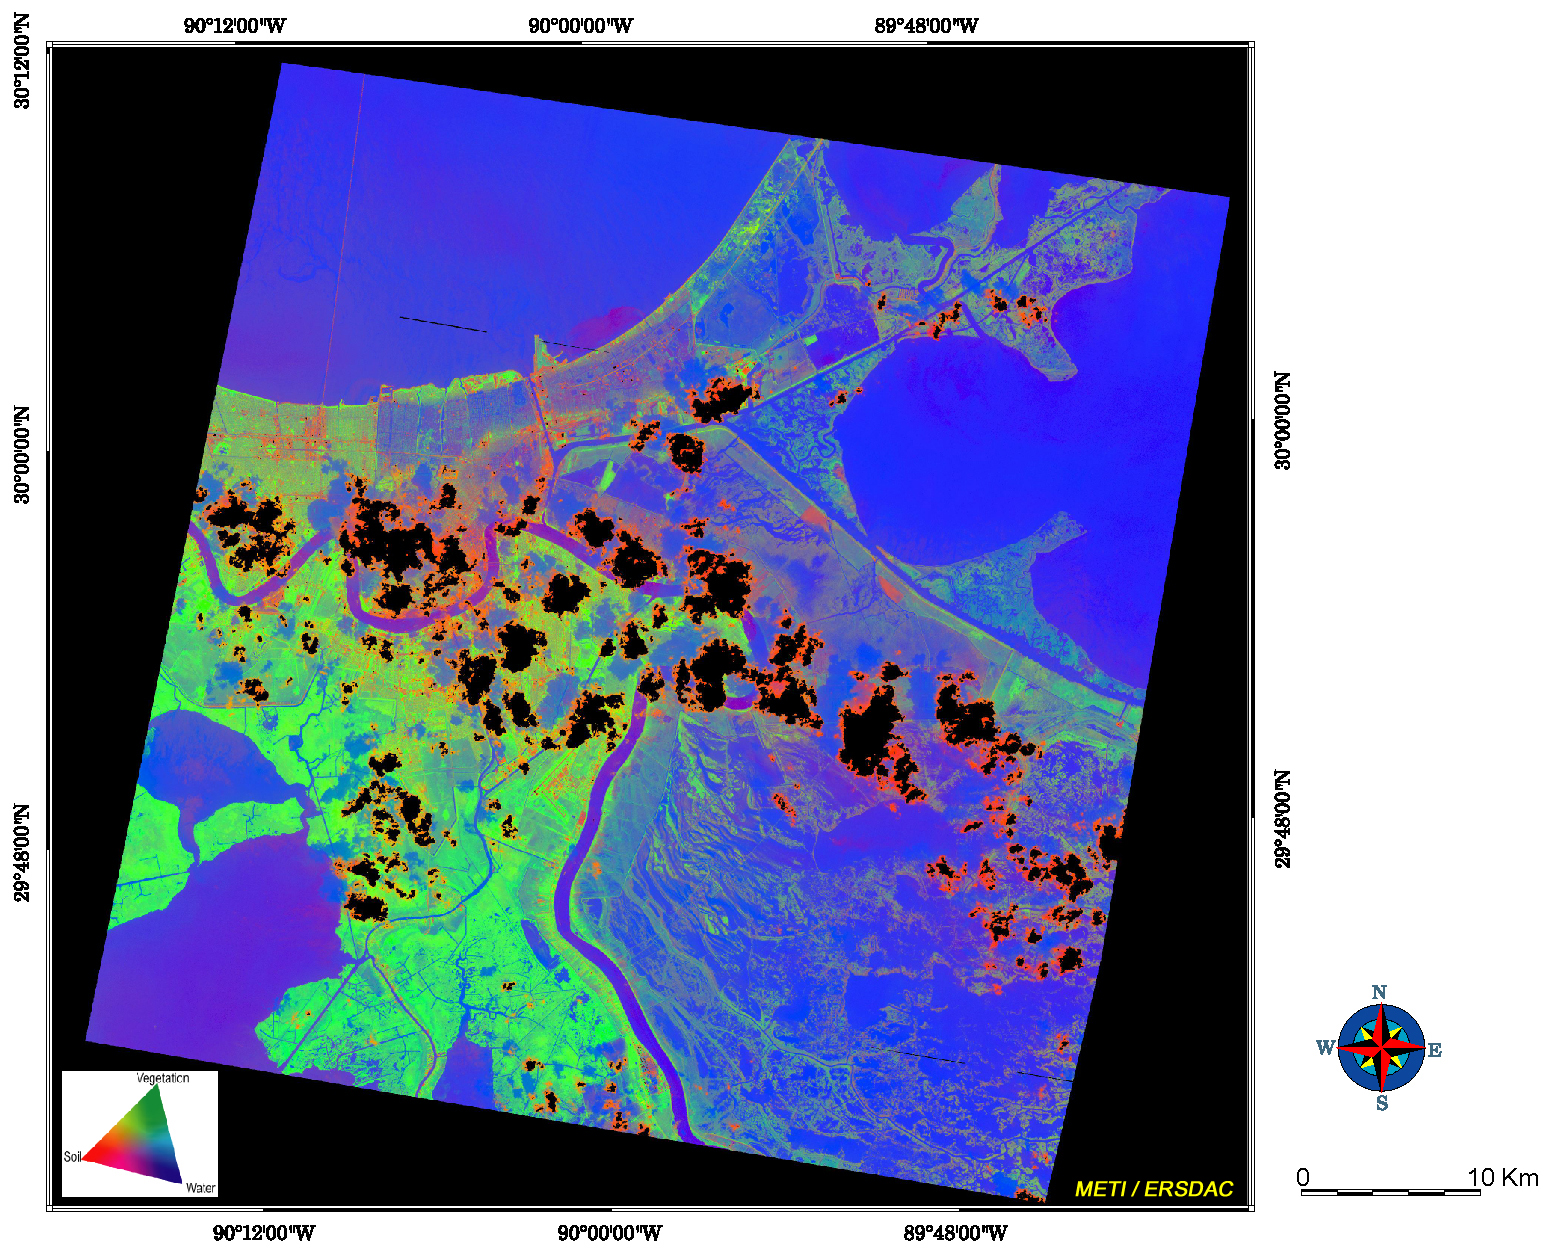
Figure 5.
Increase in water body = water index(2005.09.13) - water index(2001.09.20) warm colors have larger increase in water index |
 |
 |
 |
|
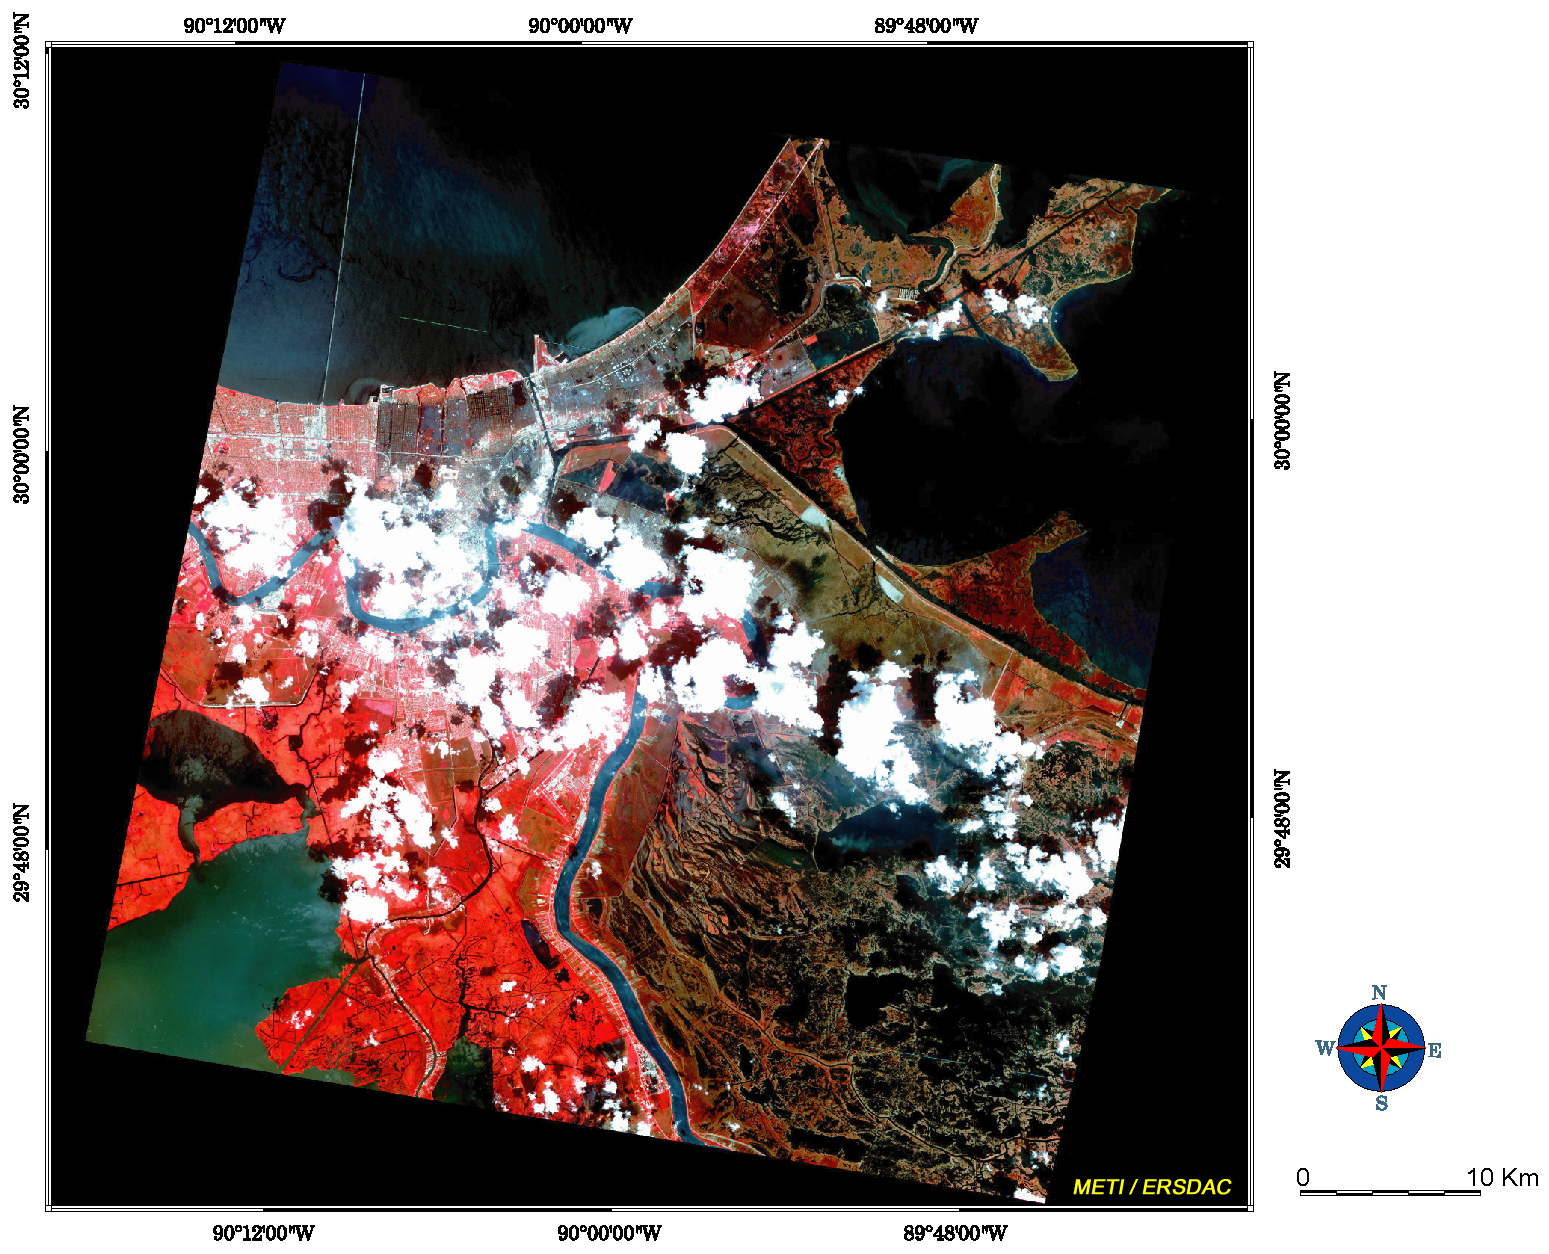
Figure 2.
False Color image observed on 2001.09.13 |
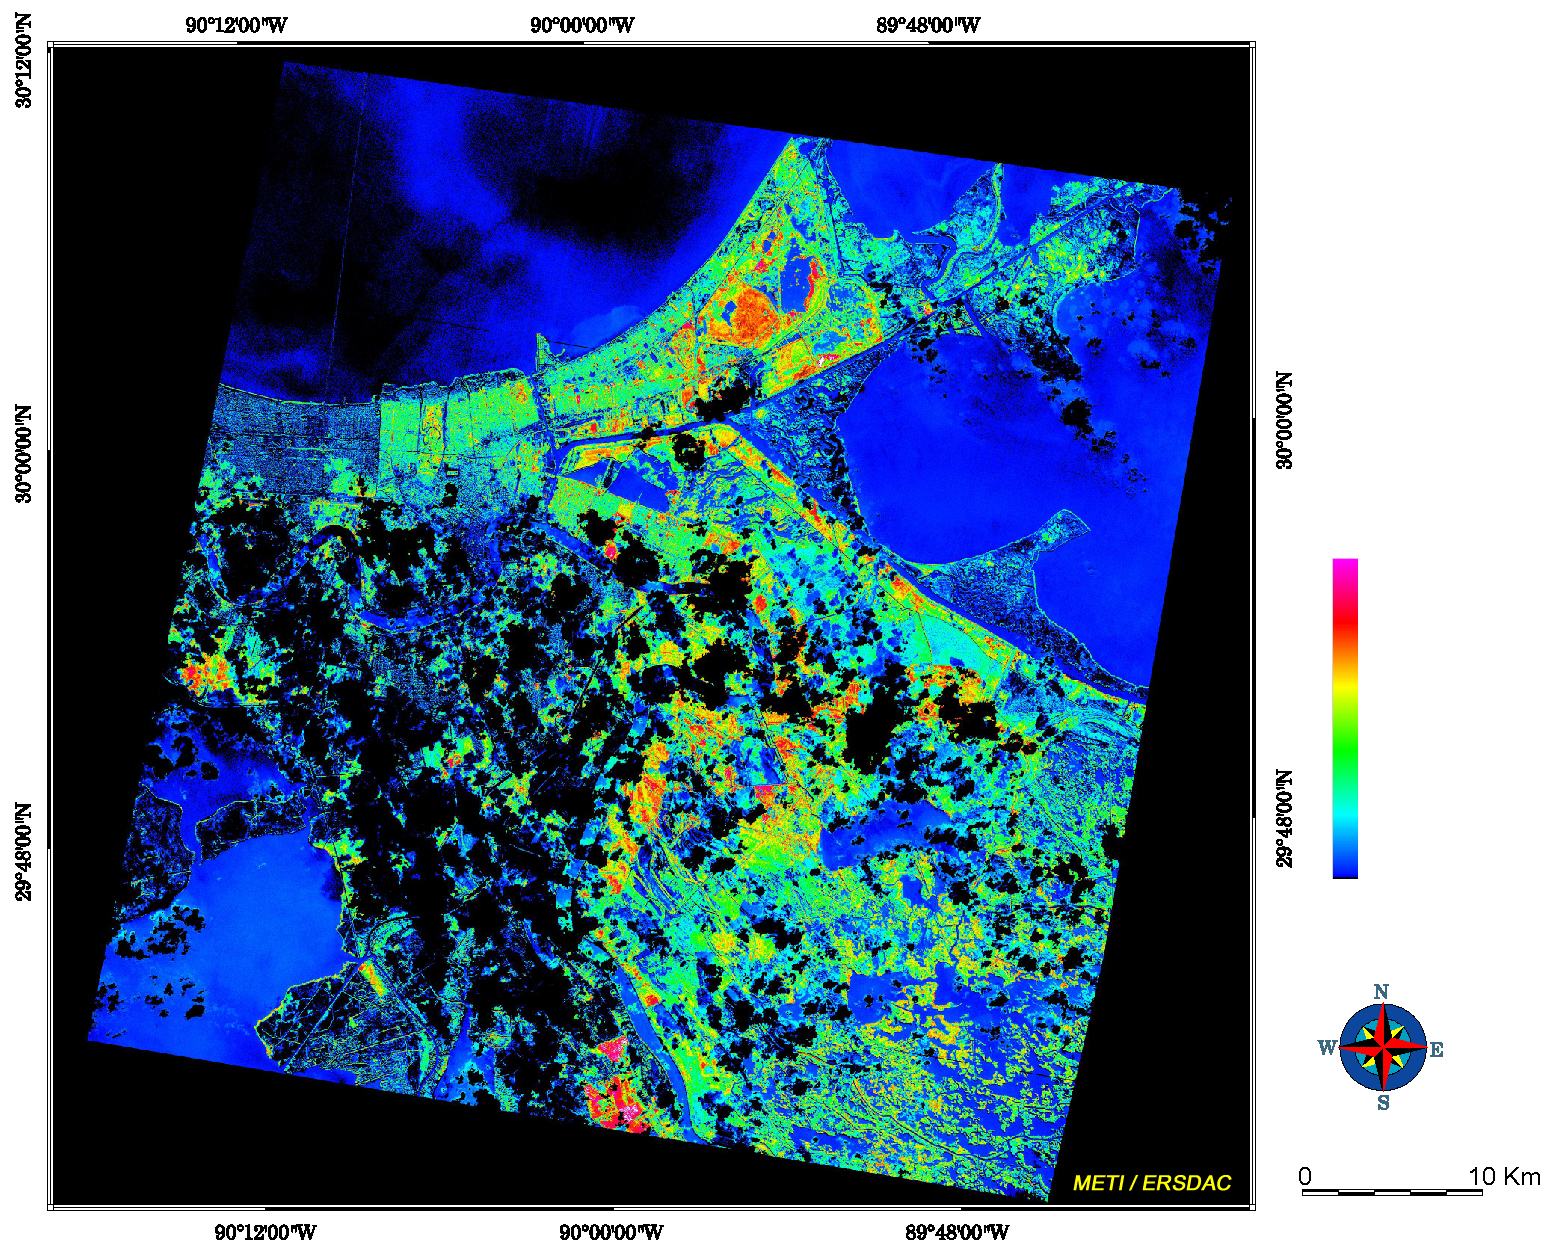
Figure 4.
VSW image observed on 2001.09.13 (B:G:R= water:vegetation:soil index) |
Figure 6.
Decrease in vegetation vegetation index= (2005.09.13) - vegetation index (2001.09.20) warm colors have larger decrease in vegetation |
2005 / 09 / 30 up
Hurricane Katrina
Hurricane Katrina, landed on the U.S. Gulf Coast on 29th August 2005, maintaining the strength that records the 4th largest in the U.S. history.
Total death toll caused by the hurricane exceeded 1,000, attesting to the gigantic scale of the disaster rarely seen in recent history.
The hardest hit New Orleans has incurred devastating damages to the whole city.
In its wake, ASTER immediately initiated emergent observation and succeeded in acquiring favorable data over New Orleans on 13th September.
Figure 1 and 2 show ASTER false color images comparing before and after the disaster.
Index of vegetation, soil and water (VSW) were calculated from ASTER data, and allocated green, red and blue, respectively to produce images shown as Figure 3 and 4.
Further, differences of VSW index were calculated to enhance increase in water index and decrease in vegetation index as shown in Figure 5 and 6, respectively.
Trend of increase in water index and decrease in vegetation index is confirmable across the region, especially eastern side.
Locations where coincidence of large changes in both indices was confirmed are considered to have suffered serious damage.