Spread of huge bushfire in Victoria, southeast Australia
2009/02/20 up
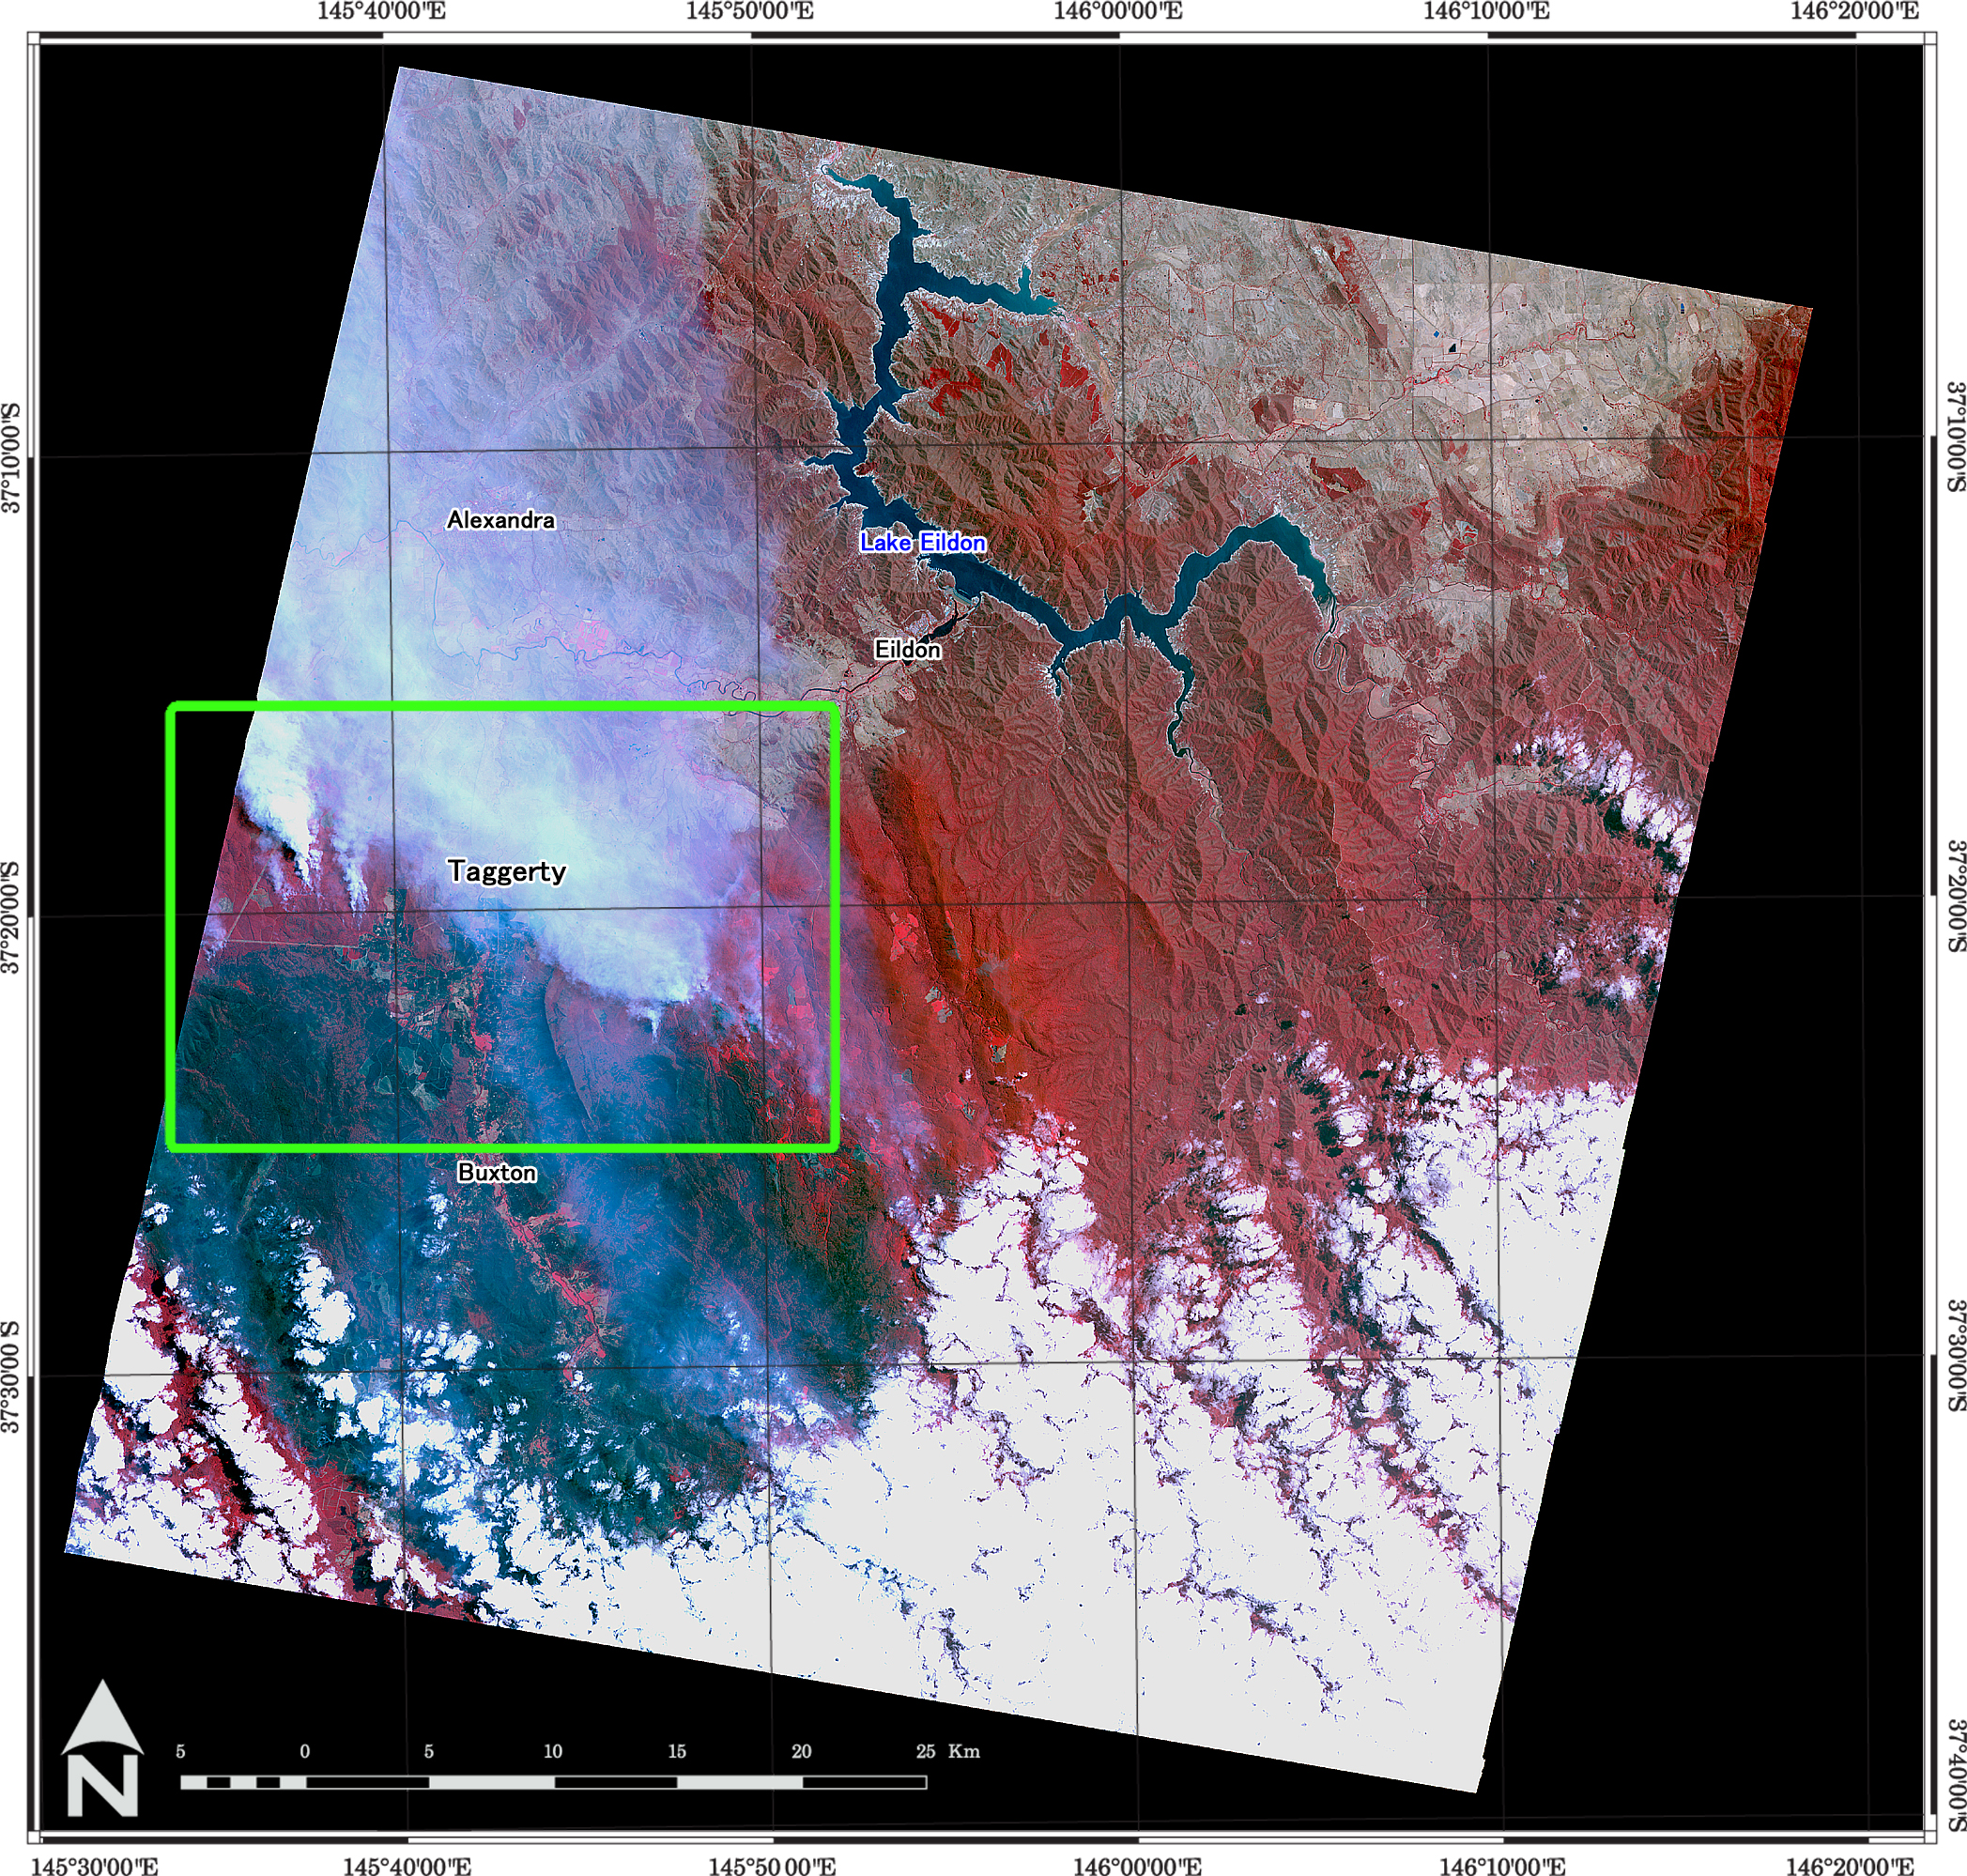
These are the ASTER images of bushfire in Southeast Australia acquired at 10:21 a.m. on February 9th, 2009 (local time).
Figure 1 (left) is the Visible and Near-InfraRed (VNIR) image which captured Taggerty area, southeast Victoria (the area specified in the above map).
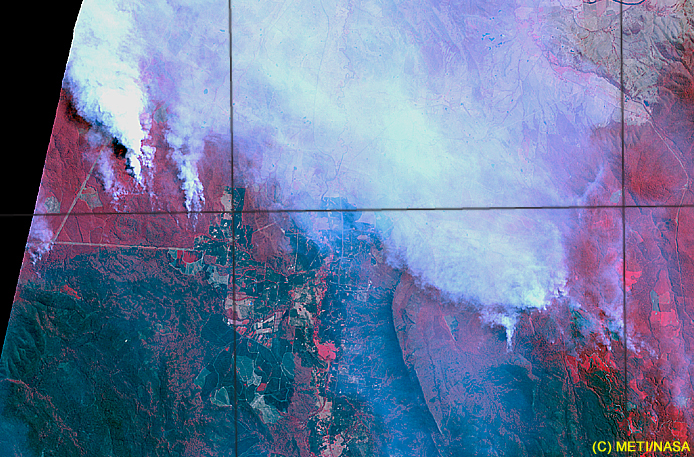
Figure 2 (left lower) is the extended image of Taggerty area (framed in green on Figure 1).
This image tells the intensity of bushfire with huge smoke. In this image, vegetation is shown in red. Meanwhile, the southwest part of this image, shown in black, is believed to be the burned-out area.
Figure 3 is the Thermal InfraRed (TIR) image of the same data.
TIR can capture high-temperature area without any interruption of smoke (in this image, high-temperature area is marked in yellow). Therefore, "the bushfire front" is recognizable.
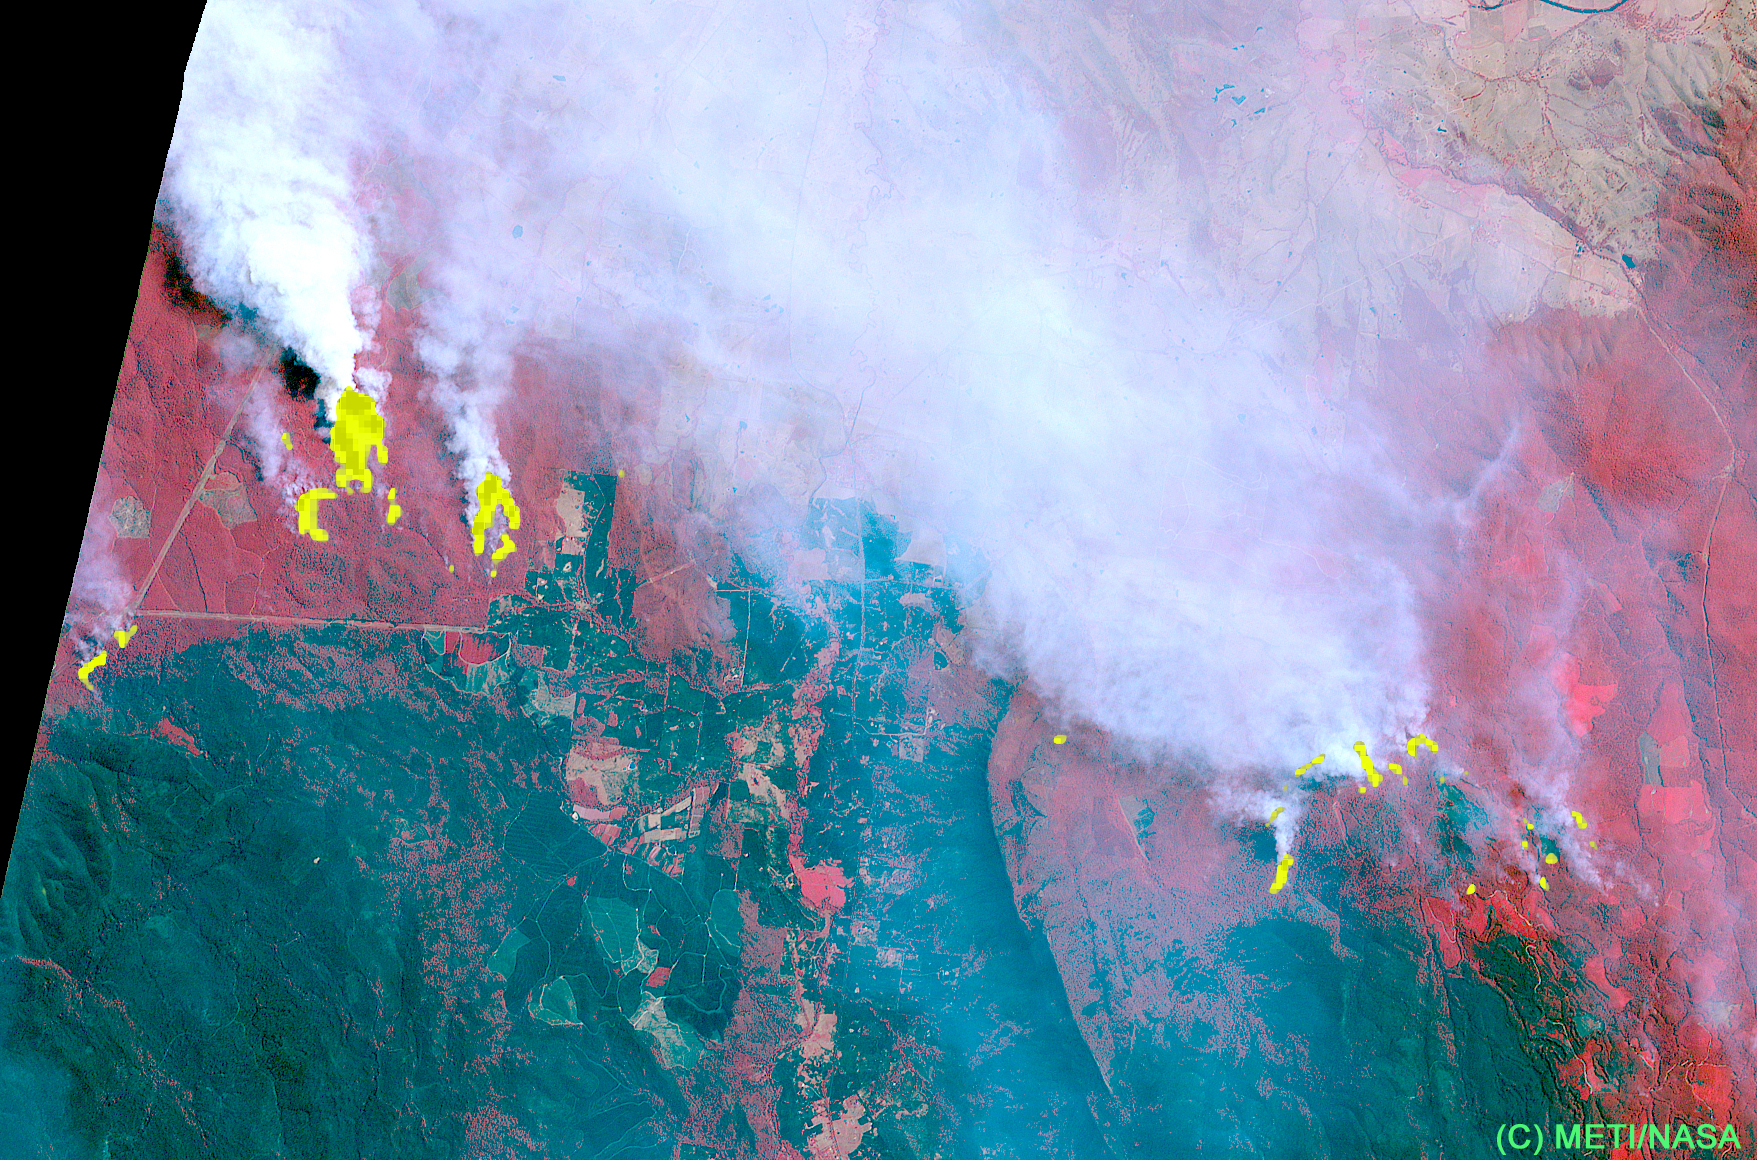
Figure 4 is made by overlaying the high-temprature area of Figure 3 on Figure 2, showing more preciously how the bushfire spreaded.
RGB:Band321(VNIR)
 |
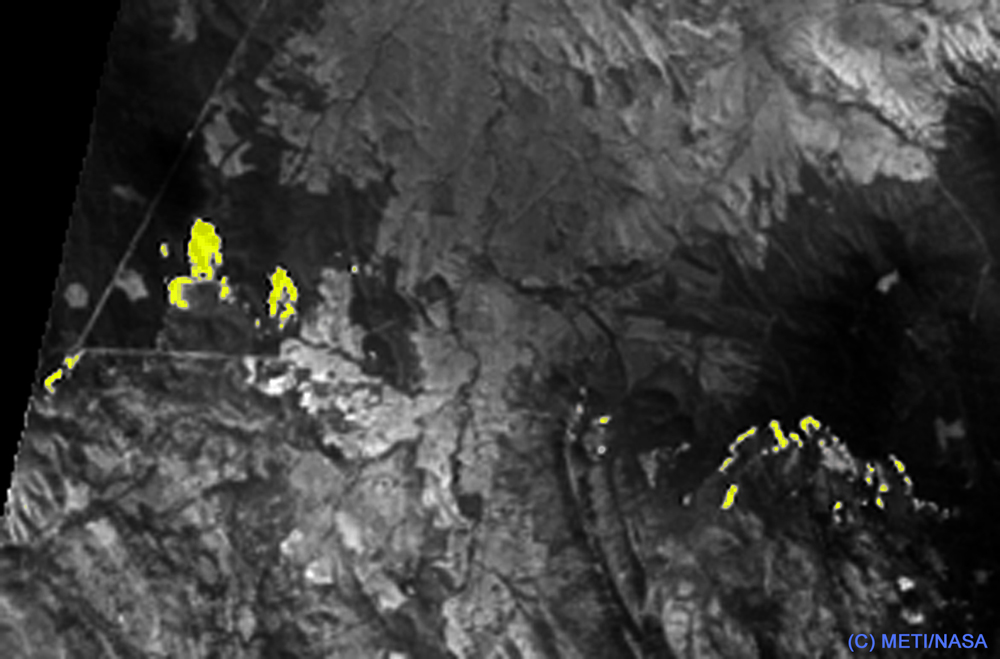 |
Figure 2 |
Figure 3 |
 |
|
Figure 4 (The overlaid Figure 2 image with the high-temprature area of Figure 3) |
|